Reply rate is the percentage of your outbound messages that receive a response, and on LinkedIn it splits into three separate metrics that share no data with each other: connection acceptance rate, connection-note reply rate, and message reply rate. Most teams track one number, call it "reply rate," and then cannot work out why it will not move.
Go looking for a benchmark and you will find that credible sources put a good LinkedIn reply rate anywhere from 3 percent to 50 percent. That spread is not because anyone is lying. It is because they are dividing by different denominators and nobody says which one.
Here is what each number actually measures, what good looks like for each, and which one is worth optimizing.
The Three Rates, and Why Conflating Them Wastes Quarters
Expandi's 2026 benchmark study, drawn from 13.2 million outreach attempts across more than 13,000 active accounts, breaks LinkedIn outreach into three independent rates. The platform-wide averages:
- Connection acceptance rate, accepted connections divided by requests sent: 28.5 percent
- Connection-note reply rate, replies to the note attached to a request, divided by requests sent: 3.0 percent
- Message reply rate, replies to outbound messages, divided by messages sent: 10.4 percent
These three metrics are independent. They share no events between numerator and denominator. A campaign can be excellent at one and terrible at another, and the aggregate "reply rate" your dashboard shows will average away the signal that would have told you which.
This is why benchmark shopping fails. When a vendor advertises an 18 percent reply rate, they almost certainly mean message reply rate, measured only against people who already accepted. When another source says 3 percent, they mean replies against total requests sent. Both are true. Neither is comparable.
Each rate diagnoses a different layer of the funnel, and you cannot fix a layer you have not isolated.
- Low acceptance, everything else untested: a targeting or sender-profile problem. Nothing downstream matters yet.
- Healthy acceptance, low message reply: a messaging problem. The right people are letting you in and your first message is not worth answering.
- Healthy message reply, no meetings: an offer or follow-up-speed problem, not an outreach problem at all.
A high acceptance rate with a low reply rate is a messaging problem. A strong reply rate with few meetings is not. Teams routinely rewrite messaging to fix a problem that was never in the messaging.
The Finding That Should Change Your Sequence
Now the part that contradicts the standard playbook.
The advice everyone gives is to personalize the note on your connection request. It is the most repeated tip in LinkedIn prospecting. And there is real evidence behind it: adding a note nearly doubles the reply rate on the request itself, from 5.44 percent to 9.36 percent, while barely moving acceptance at all.
But look at the note pathway over time and it is decaying. Expandi's 2026 data shows connection-note reply rates falling from 3.5 percent to 2.2 percent over twelve months, a 37 percent relative decline. Over the same period, message reply rate held flat at 10 to 11 percent. It did not erode at all.
Read that again, because it has a direct strategic consequence. The channel everyone tells you to optimize is the one that is dying. The channel nobody talks about, the message you send after the connection is accepted, is stable and roughly five times more productive per attempt.
If your pipeline depends on people replying to your connection note, your primary input is shrinking under you, and it will keep shrinking. The hedge is to stop treating the note as a pipeline input and start treating it as what it is: a small acceptance-neutral nudge that slightly improves your odds later. Build the pipeline on the post-connection message instead.
Worth being precise about the reason. Note replies are declining because inbox saturation is real. One study found 89 percent of prospects now receive more than fifteen connection requests a week. A note is competing in the most crowded surface on the platform. A message to an accepted connection is not.
What Good Actually Looks Like
Working benchmarks for a well-targeted B2B campaign, assembled from published platform data:
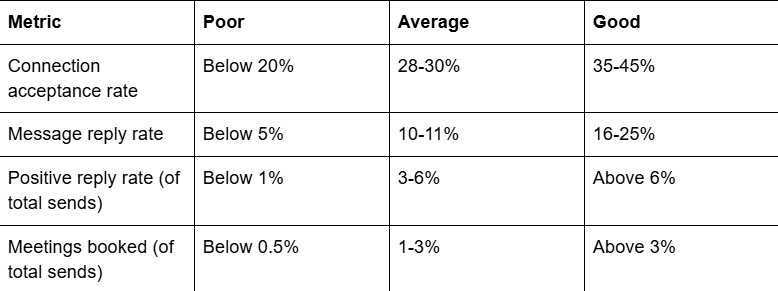
Two things to flag about this table.
Your industry moves these numbers more than your copy does. Staffing and recruiting sees connection acceptance around 36.5 percent. Apparel and fashion sits near 19.9 percent. SaaS and technology has among the lowest reply rates in the dataset, around 4.77 percent, precisely because that inbox is the most saturated. If you are selling software to software people and benchmarking yourself against a generic platform average, you will conclude your campaign is broken when it is performing normally for its segment. Benchmark against your vertical or do not benchmark at all.
Acceptance rate is also an account health metric, not just a performance metric. LinkedIn throttles accounts whose requests are consistently ignored or flagged. Sustained acceptance below roughly 25 to 30 percent starts to reduce your future sending capacity. A bad acceptance rate does not just cost you this week's connections, it costs you next week's ceiling.
Positive Reply Rate Is the Only One That Predicts Pipeline
Here is the metric almost no dashboard shows you by default.
Total reply rate counts every response. That includes "no thanks," "please remove me," and "I'm not the right person." Your tool reports those as replies, and they inflate the exact number you are being measured on.
Positive reply rate, responses that indicate genuine interest, is the number that actually correlates with pipeline. For a well-targeted B2B campaign, 3 to 6 percent of total sends is a solid benchmark.
The diagnostic value here is sharp. If your total reply rate looks reasonable but your positive reply rate is low, you do not have a messaging problem. You have an ICP problem. The right volume of people are replying and they are the wrong people. Rewriting your message will not fix that. Tightening your target list will.
This is the single most common misdiagnosis in B2B outreach, and it survives because most teams never separate the two numbers. They see replies coming in, assume the campaign works, and spend a quarter optimizing copy while the list quietly stays wrong.
Levers That Actually Move Reply Rate
Once you know which rate you are trying to move, the data on what works is reasonably clear.
Add supporting actions, not just messages. Campaigns that pair a message with other actions, a profile visit, engagement with a recent post, reach reply rates up to 11.87 percent, roughly double single-action campaigns. The touches do the work before the message lands.
Use AI on the first message, less so on follow-ups. AI-assisted first messages reply at 4.19 percent versus 2.60 percent without. But follow-ups perform slightly better without it, 3.91 percent versus 3.48 percent. The pattern makes sense: the first message needs research the sender does not have time to do manually, while a follow-up needs to sound like a person who already spoke to you.
Send early in the week. Tuesday is the strongest day at 6.90 percent, Monday close behind at 6.85 percent, tapering to 6.40 percent on Saturday. The effect is small. Do not build a strategy on it, but do not schedule your main send for Friday afternoon either.
Narrow the list before you rewrite the message. This is the highest-leverage lever and the least glamorous one, and it follows directly from the positive reply rate point above.
Why Reply Rate Gets Worse as You Scale, and What to Do About It
Everything above assumes you can actually see and act on your replies. At real volume, that assumption breaks.
Teams that scale LinkedIn outreach run multiple sender accounts, because a single account is capped at roughly 100 connection requests per week. Five accounts means five separate LinkedIn inboxes. Replies scatter across all of them, and a warm reply that sits unread for three days converts like a cold one.
At that point your measured reply rate is still climbing while your actual pipeline stalls, which is the worst possible failure mode, because the dashboard says the campaign is working.
This is the specific gap OutFlo is built to close. The Unified Smart Inbox puts every conversation across every connected sender account into one stream, so no reply is stranded in an account nobody logged into today. More usefully for this article: incoming replies are auto-sorted into Interested, Not Interested, and Generic, which means positive reply rate stops being a number you have to reconstruct by hand and becomes something you can just read. The dashboard surfaces Interested Leads as a headline metric alongside total replies, and supports an Interested versus Not Interested comparison card directly, so the two numbers are visible side by side rather than collapsed into one.
Smart Sequences handle the multi-action point, branching on what actually happened, whether a profile was viewed, whether a connection was accepted, whether a message was read, rather than firing a fixed script. AI Personalization covers the first-message lever, drafting from a prospect's real recent activity, which is exactly where the AI lift shows up in the data and exactly where doing it manually stops being possible past a few dozen prospects.
The measurement problem and the volume problem are the same problem. Reply rate only means something if you can see which replies were worth having.
FAQ
Common questions
What is a good reply rate for LinkedIn outreach?
For message reply rate, meaning replies to messages sent to accepted connections, the platform average is around 10 to 11 percent and well-targeted campaigns reach 16 to 25 percent. For connection-note reply rate, measured against total requests sent, the average is far lower at around 3 percent and falling. Always confirm which of the two a quoted benchmark refers to, because they are not comparable.
Why do published reply rate benchmarks vary so much?
Because they use different denominators. A tool reporting 18 percent is usually measuring replies against accepted connections only. A study reporting 3 percent is measuring replies against every request sent. Both can be accurate descriptions of the same campaign. This is also why benchmarks quoted without a stated denominator are close to useless.
Is total reply rate or positive reply rate more important?
Positive reply rate, by a wide margin. Total reply rate counts rejections and "wrong person" responses, which means it can look healthy while producing no pipeline. Positive reply rate, typically 3 to 6 percent of total sends for a good B2B campaign, is the number that tracks with meetings booked.
My reply rate is fine but I am not booking meetings. What is wrong?
Usually one of three things, and reply rate cannot tell you which. If total replies are high but positive replies are low, the target list is wrong. If positive replies are healthy but meetings are not, the problem is the offer or the speed of your follow-up. If replies are simply going unanswered for days, and this is far more common than teams admit, the problem is inbox management, not outreach.
Should I still personalize my connection request note?
Yes, but not as a pipeline strategy. A note barely changes acceptance rate (26.42 percent with, 26.37 percent without) and roughly doubles reply rate on the request itself. But note reply rates dropped 37 percent over the past year while post-connection message reply rates held flat. Use the note, do not build the funnel on it.
Does industry affect reply rate benchmarks?
Substantially. Staffing and recruiting sees connection acceptance near 36.5 percent, while apparel and fashion sits closer to 19.9 percent. SaaS and technology has some of the lowest reply rates on the platform, around 4.77 percent, because that audience is the most heavily prospected. Benchmark against your own segment, not the platform average.