Say you are managing outreach across 21 campaigns and 12 accounts. Requests accepted, replies, and interested leads make a useful default view—but the number that matters most to you might be Meeting Booked, or a direct comparison of Interested against Not Interested.
Dashboard is built to be rearranged around what you are actually tracking, not only the default set.
1. Turn on Editing
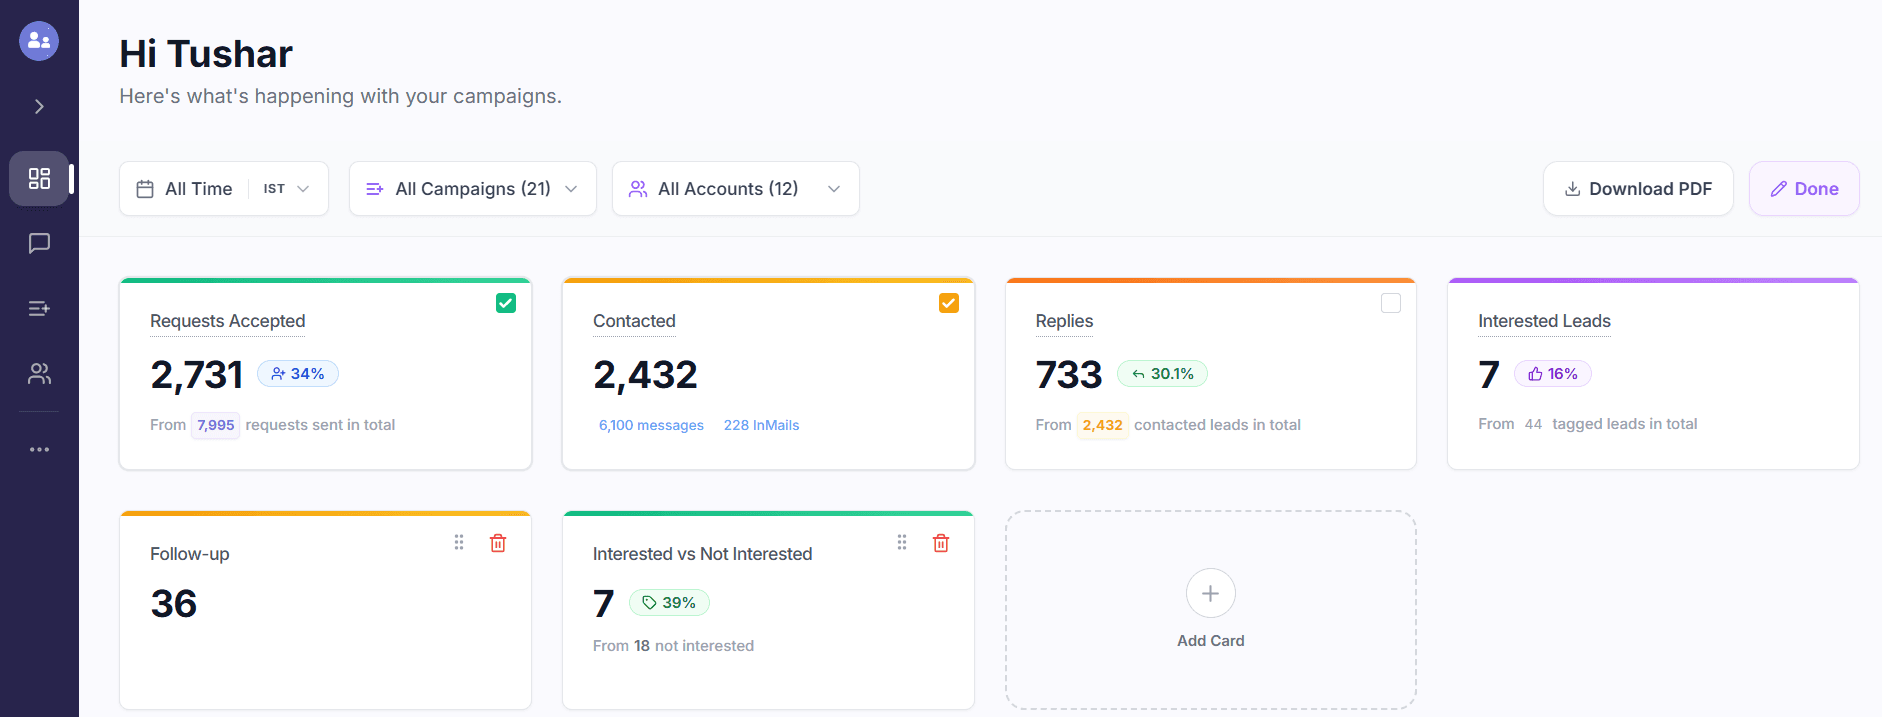
At the top right of Dashboard, click the pencil icon next to Done. The board enters edit mode: editable cards get drag handles and delete controls, and an empty Add Card tile appears wherever there is room.
2. Add a Custom Card
Click Add Card to build a card around any metric you track, including your own custom tags. If you tag leads as Meeting Booked, for example, that tag can become a card showing its count and rate just like the default Requests Accepted or Replies cards.
You can also create comparison cards such as Interested vs Not Interested. A comparison puts one value against the other as a percentage instead of showing two unrelated totals.
3. Reorder by Priority
The first four cards—Requests Accepted, Contacted, Replies, and Interested Leads—are fixed. They remain your core funnel view.
Any card you add can be dragged. While in edit mode, grab a custom card by its handle, move it into the order you want, and click Done. The layout saves automatically.
4. Filter Before You Look
The controls above the cards let you scope the whole dashboard by:
- All Time or a specific date range
- All Campaigns or one campaign
- All Accounts or one sender
Every card updates with the selected scope, so you can inspect one campaign without unrelated activity diluting the result.
5. Download the Report
Click Download PDF at the top right to export a complete performance report. It includes the key dashboard metrics, a trend chart for the reporting period, and breakdowns by sender and campaign—including sent, accepted, contacted, and reply rate.
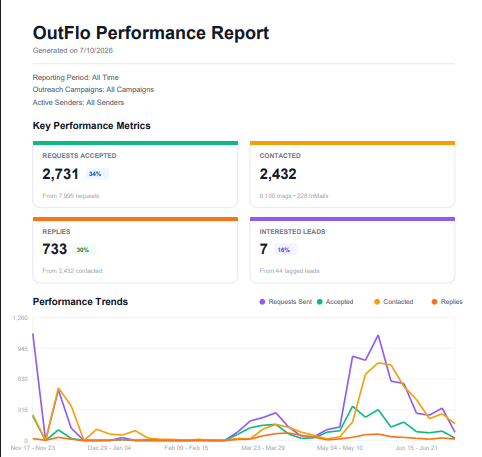
The report is ready to share with a founder, client, or teammate who does not have Dashboard access.
When to Use This
Customize the cards once you know what your team is working toward, then leave the layout stable for day-to-day use. Return to editing when a new goal, tag, or comparison deserves a place on the board. Export a PDF whenever you need to hand off performance outside OutFlo.
Quick Summary
- Click the pencil icon next to Done to enter edit mode.
- Click Add Card to create a metric, custom-tag, or comparison card.
- The first four cards are fixed; custom cards can be reordered with their handles.
- Use the time, campaign, and account filters to scope every card at once.
- Click Download PDF to export metrics plus sender and campaign breakdowns.
The default Dashboard shows what OutFlo thinks matters. Editing it makes the board show what you think matters.