
A useful campaign report explains what happened, who the numbers describe and what your team should inspect next. A larger reply count alone does not tell you whether the audience improved or whether the campaign simply ran longer.
OutFlo's Dashboard lets you filter recorded performance, add tag-based cards and export a PDF. Start by deciding which question the report should answer.
Fix the reporting scope
Choose the workspace, reporting period, campaign selection and sender selection before interpreting the cards. Write those choices into the report's accompanying explanation.
Examples of useful questions include “How did this campaign perform this month?” and “Which sender's results need a closer review?” Compare periods and cohorts with similar scope. One account over a week is not directly comparable to ten accounts over a quarter.
Remember that a general campaign filter can include eligible historical campaigns, not only campaigns sending now. Verify the selection rather than reading All Campaigns as “all active campaigns.”
Read counts and rates together
A count answers how much recorded activity occurred. A rate compares it with a denominator. Check the metric's definition before combining it with another card.
For a fictional example, 10 replies from 100 contacted people is 10%, while 15 replies from 300 contacted people is 5%. The second group produced more replies but a smaller share of contacted people replied. This arithmetic illustrates reporting interpretation; it is not an OutFlo customer benchmark or a definition of every Dashboard rate.
A reply can also arrive after the initial outreach period. Review the selected dates and underlying activity before treating a short reporting window as a completed campaign outcome.
Define your custom funnel stages
Use custom tags for outcomes your team can consistently verify. Define each one before using it in a report:
- Example tag
- Qualified
- Suggested team definition
- A teammate confirmed the agreed fit criteria
- Example tag
- Meeting confirmed
- Suggested team definition
- A meeting was actually arranged, not merely offered
- Example tag
- Not now
- Suggested team definition
- The prospect explicitly deferred the conversation
| Example tag | Suggested team definition |
|---|---|
| Qualified | A teammate confirmed the agreed fit criteria |
| Meeting confirmed | A meeting was actually arranged, not merely offered |
| Not now | The prospect explicitly deferred the conversation |
These are suggested conventions, not automatically inferred commercial outcomes. An interested reply is not necessarily a qualified lead, and a calendar link sent is not a booked meeting.
Make sure the tag has been applied to at least one lead so it is available for custom-card selection. Keep definitions stable between reporting periods, or explain when they change.
Customize the Dashboard
Use the pencil icon to enter edit mode and choose Add Card. Select the available metric or custom tag, or use a comparison card where it answers a meaningful question.
The core cards—Requests Accepted, Contacted, Replies and Interested Leads—remain fixed. Reorder your custom cards to follow your reporting narrative, then choose Done.
Keep the layout focused. If your weekly review depends on qualified conversations, make that custom outcome easy to find rather than adding every tag your team has ever used.
Investigate a change before explaining it
If a result rises or falls, drill into campaign and sender results and inspect representative lead timelines and conversations. Check whether the change coincides with a different audience, message, reporting scope, sender availability or inconsistent tagging.
For example, a lower reply count may reflect fewer eligible messages sent because a sender was disconnected. Rewriting the message would not address that operational issue. An unusually high “Meeting confirmed” count may instead require a review of tag usage.
Recorded results describe performance; they do not prove that a particular feature or wording caused an improvement.
Export and review the PDF
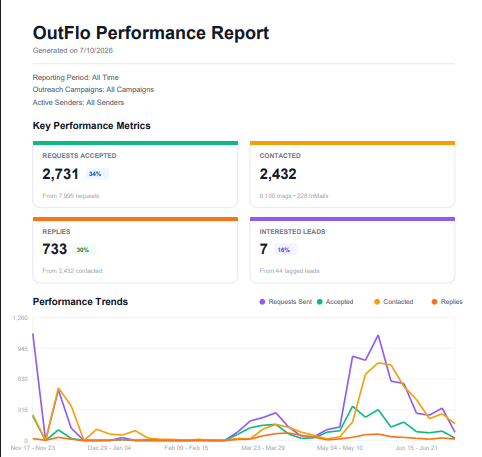
Choose Download PDF for the reviewed scope. The report includes dashboard metrics, reporting-period trends and sender/campaign breakdowns. Inspect the file before sharing it: confirm the period, scope, labels and whether custom tags mean what the recipient expects.
Add a brief interpretation covering one observation, the evidence behind it and the next action. Avoid making the recipient infer the entire story from percentages alone.
See the Dashboard card and PDF walkthrough or explore Analytics and Reporting.